All of my test and practice flights so far have been in a nearby field, which is accessible to the public and essentially not used apart from the occasional dog walker. It’s perfect for some quiet practice with lots of open space and no obstacles - apart from a perimeter of trees. Perfect - just a little boring.
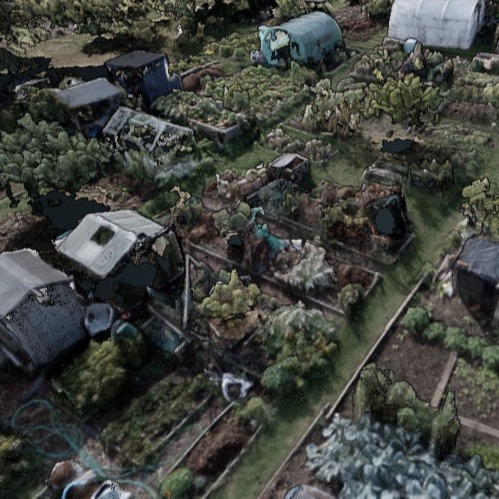
So time for a more varied terrain. Just a short walk across another field there’s some interesting allotments. A sloping site with a fair few large trees and a complex array of mini gardens. Many with sheds or greenhouses, complex planting or some totally bare ready for the next season.
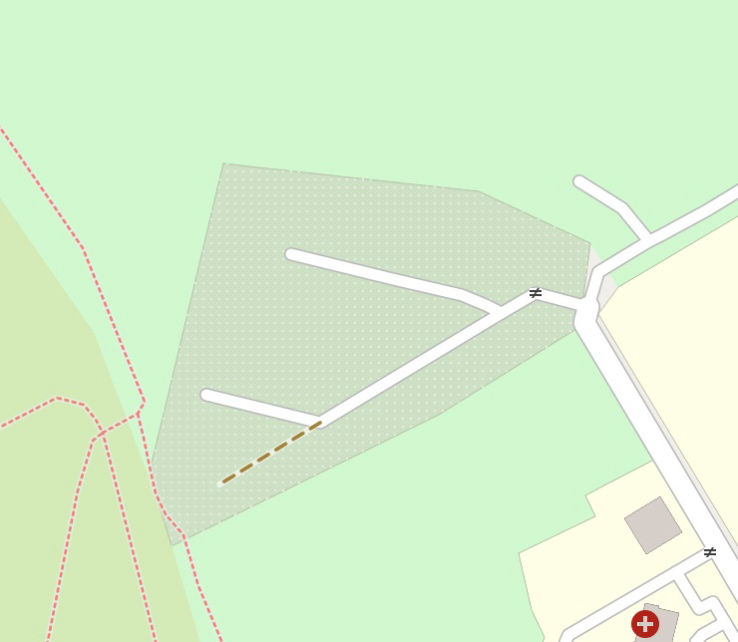
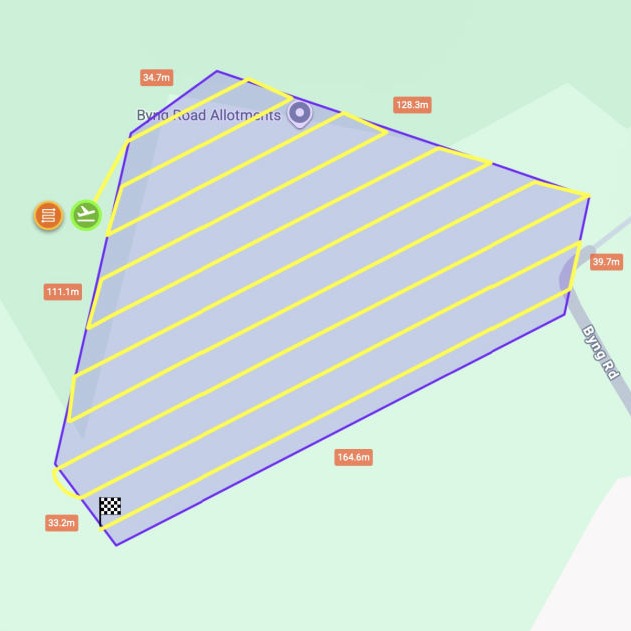
Time for Litchi… and a new waypoint mapping mission. I try a few different settings while considering the results from my earlier field. The site covers 1.6 hectares (4 acres) and Litchi gives me a route that captures around 230 photos taking about 13 minutes to complete the flight.
Off I go, and still being a bit nervous, hope to not bump into any nosy dog walkers. The sky is blue, the air is calm, and nobody’s around, so up we go and straight into the flight - this time remembering to start the photo capture.
The site is quite large and the sun is shining bright, so I find it hard to keep an eye on the drone. This makes me think about the ‘visual line of site’ requirement that regulations state I must stick to. It’s not that far away but it’s quite small and I do struggle a bit to keep an eye on it all times. I will have to read up a bit on how people deal with this in the real world. I do of course have a constant display in my hand of what the drone is seeing, so even for those odd moments I can tell it’s still under control and doing what I expect it to.
With the flight completed and photos saved, it’s time to process. I’ve been experimenting quite a lot with WebODM settings and haven’t perfected it yet as I’m trying to balance processing power with quality. Some of the differences are quite remarkable and show that things can easily appear wrong if the settings aren’t quite right.
My aim for this area was to be able to generate a high quality orthomosaic, a DSM, a DTM, and a Point Cloud (ideally with good point classification), plus I wanted to be able to make it all easily viewable on the web.
I decided to try processing these in the cloud, using WebODM Lightning. I wanted to see how paying for cloud processing would compare to grappling with my own processing power (and the cost of upgrading that). The results were quite visibly different which surprised me a little, some better and some worse. Also some of the settings were a little different so making direct comparisons wasn’t that easy. However in summary - it was quick (perhaps a third of the time) pretty easy to follow and the cost would have been less that £10 (I had some sign-up credits).
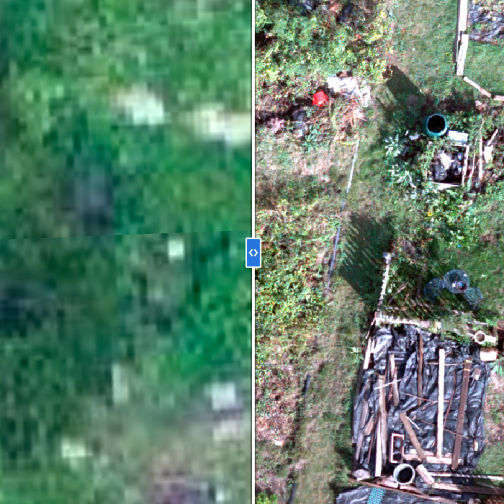
It's great to see the difference in quality that we can achieve when compared to the usual satellite photos that we are now used to. To the right is a direct comparison of the same area showing Google Maps and an extract from the Orthomosaic.
Below is a selection of the outputs as generated by WebODM - with a little bit of further processing in QGIS.
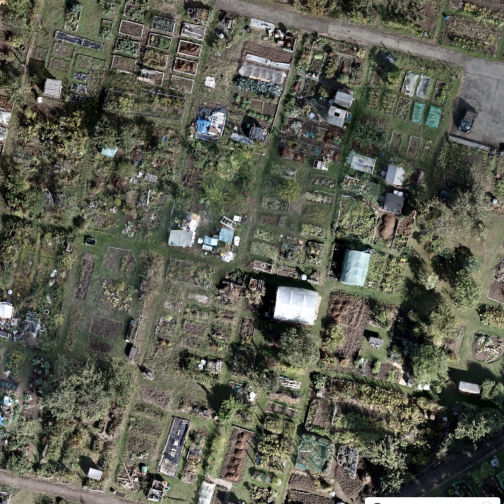
This is the combined 'orthorectified' measurable aerial photograph stitched together from over 250 drone photos.
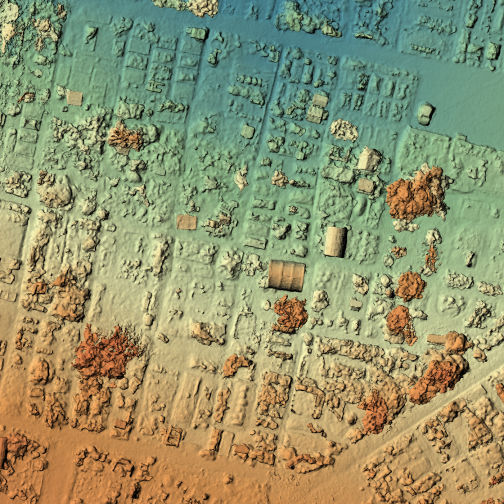
This extract of the DSM shows how the height differences are captured with the darker colours representing greater height.
The DTM also shows height differences but with buildings trees etc removed to give the shape of the land beneath.
130,000,000 individual coloured points, each identified as part of a building, tree, ground etc, make up this measurable 3D model.
Offline Website Software