I mentioned Point Clouds when discovering DSM and DTM, but I’ve known about point clouds for years, just in a slightly different way.
I first came across point clouds in the mid 2000’s, working on the redevelopment of Kings Cross in London. Laser scanning was relatively new to the industry and was a major step forward in surveying existing buildings. Tripod mounted scanners were placed in multiple locations around buildings and the lasers would essentially bounce off the buildings and identify millions of points that would then become the point cloud.
This type of scanning is commonplace now in design and construction and I have worked with numerous laser scanned point clouds over the years.
I have also been aware for some years that phone cameras with built in lidar capabilities are able to generate point clouds. But, point clouds from drone photography is all new to me, and I’m enjoying experimenting with it.
Closeup a point cloud looks like a mess of dots - but that's really just the same as photograph where if you zoom in enough you just see random coloured squares (pixels). The difference with point clouds is that each point exists in a 3D space and every point can contain all sorts of data. The X/Y/Z position of course, the colour of the surface it represents, but also it can store what that point is actually part of (eg: a building, a car, a tree). All of this data makes the point cloud a fascinating resource, if it can be easily viewed and interrogated that is...
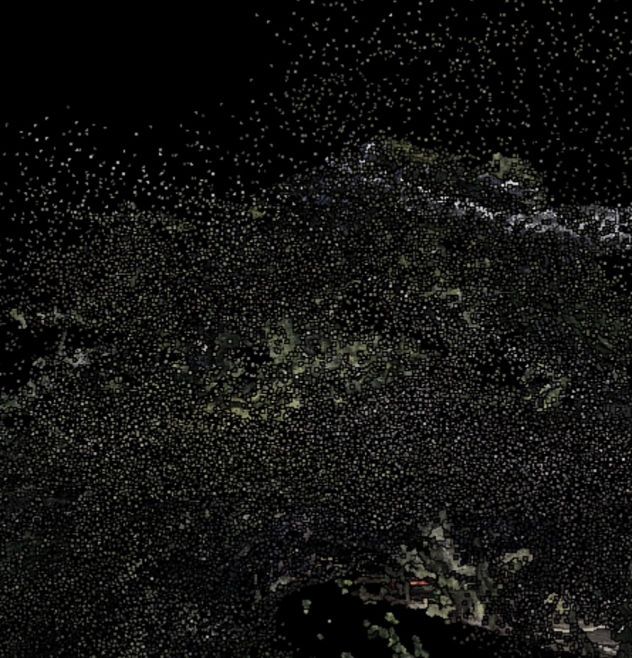
One of the most interesting parts of drone mapping is making the data captured easily useable for those interested in the site. Having accurate 2D and 3D output from a mapping project is rather pointless if the results aren’t easy for others to interrogate.
During my first projects I was creating orthomosaics and 3D visuals, but other than making interesting pictures these outputs weren’t really that useful for an end-user to investigate themselves.
I had spent a fair amount of time trying to find a nice web viewer for the 3D models that WebODM produces. I was having some success, but the end result was limited to just viewing.
Then by chance I stumbled across a point cloud web viewer. I should have noticed this earlier as its actually used by WebODM itself.
Potree is an open source web viewer capable of handling massive point clouds. It also has numerous tools for measuring and viewing the data in different ways.
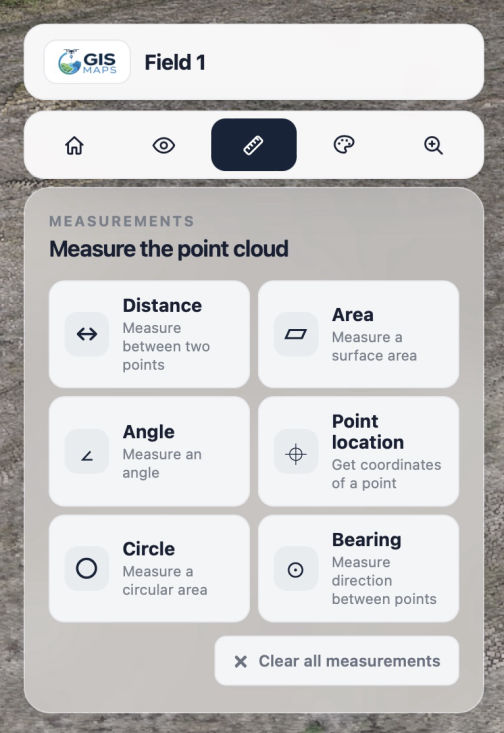
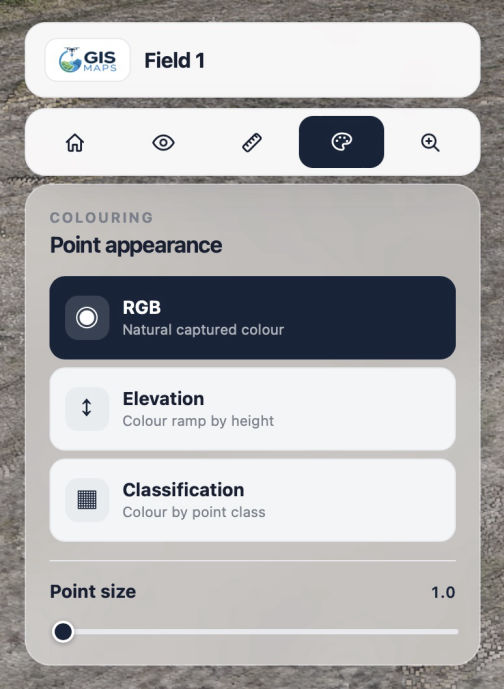
Measure boundaries, buildings or paths, measure areas of fields, gardens, rooftops and more. Visualise sites to highlight elevation changes, and even show categorisation of different land uses.
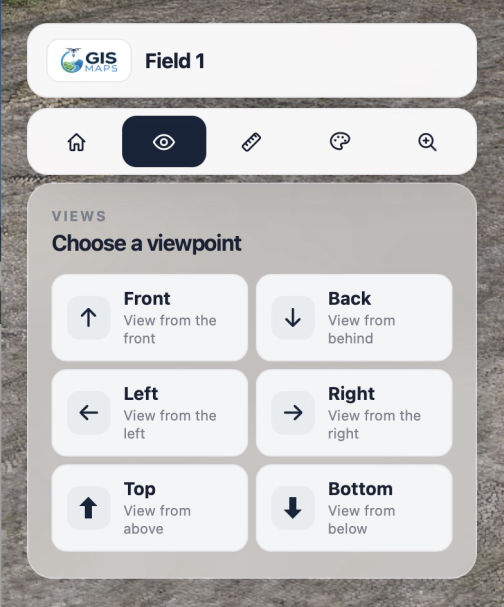
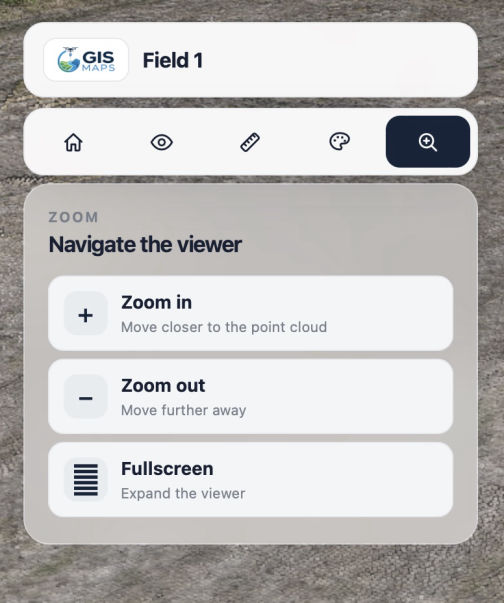
The only thing I didn’t like about Potree was the interface - It's good, but quite complicated for people that just need the basics. I wanted a simpler lightweight version to use on my website, where people could easily view and measure their land.
So, AI time again - I knew the key tools I wanted, and the type of interface, so I fed all info, in quite a lot of detail, to Claude and let it work its magic.
Bingo, my own simplified version of Potree. I’m really happy with the results, and I now have a simple dynamic interface that I can use to display all of my point clouds.
Best AI Website Creator