Project 1
Combining GPS trails in QGIS

When out walking, especially in unfamiliar areas, we regularly record our routes as a GPS trail using my Apple Watch. I’ve always found these routes interesting and enjoy seeing the areas that we’ve covered. Sadly though only one route can be viewed at a time, so seeing all areas that we’ve visited becomes quite tricky.

So the first task I've set myself in QGIS was to see if I could collate all of these routes onto one overview map.
Map

First, find the data

Well, it's all there on your iPhone, in the Apple Fitness app, so we just need to access it. It's not obvious, but fortunately it's not too difficult to get hold of.

In the Health App, there is an option to ‘Export all data’ and this includes all of the saved workout routes.

What you'll find is a folder full of .gpx files. These are basically just .xml files structured nicely so that we can extract what we need.

What data is there?

These .gpx files aren't the easiest to read, so it's not immediately obvious what we can use. But, we live in the modern world and we don't need to be experts at everything now, so we can just ask ChatGPT (sad I know, but it works).

Essentially the file contains two main things, a 'Track' which is the route as a line, but also numerous 'Track Points', and each of those points has associated data like Latitude, Longitude, Elevation & Timestamp. There's also a start and finish Timestamp for the whole route.

The lines are the most obvious visual element and these work nicely, but I soon found that there is a tonne of interesting info that can be extracted from the individual points. Sadly I also found there are so many of these points that it kills my ageing laptop trying to do anything with them. But that's ok, this is my first attempt, so I'm happy sticking to the basics (for now).

Loading it in

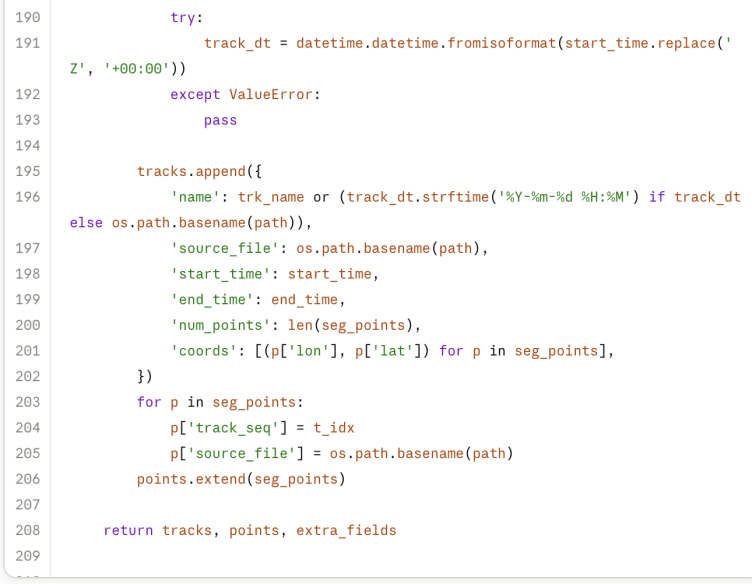
Loading a single file into QGIS is often straightforward, you can basically drag it in, and if it's a recognised format, the data gets loaded. But for hundreds of files in one go, we need a better approach, and that involves a bit of Python!

I'm not going to go into detail here, but I soon discovered that QGIS has a Python Console that can be used for automating all kinds of things. I've had some experience previously with this kind of scripting, and I also know the easy way to get going with it - Claude AI.

So, I told Claude about the files I have and what I want to do them - combine them so they can all be viewed on a single map. 

Mobirise Website Builder

Publishing the results

A big part of any project is going be publishing the results. QGIS may be the focal point of collating data, but it's not immediately shareable, so I'm exploring a few options for getting the outputs onto the web.

Many options involve complex server-side databases and configurations. I don't want to get into that right now, so am looking at plugins that export static html files. A reasonable compromise at this stage.

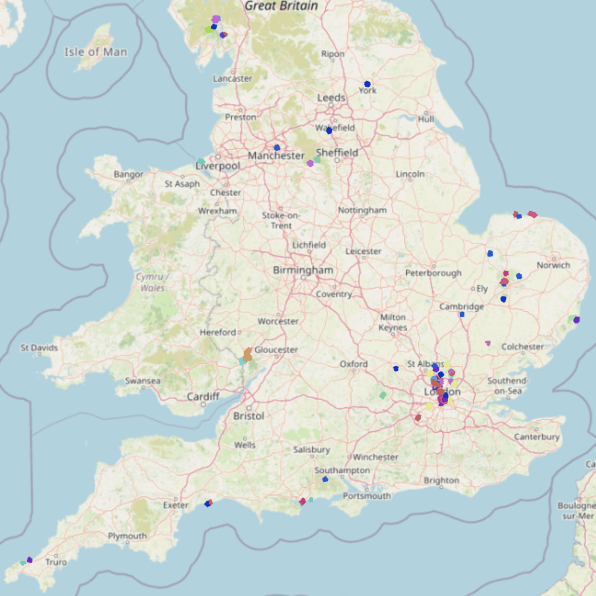
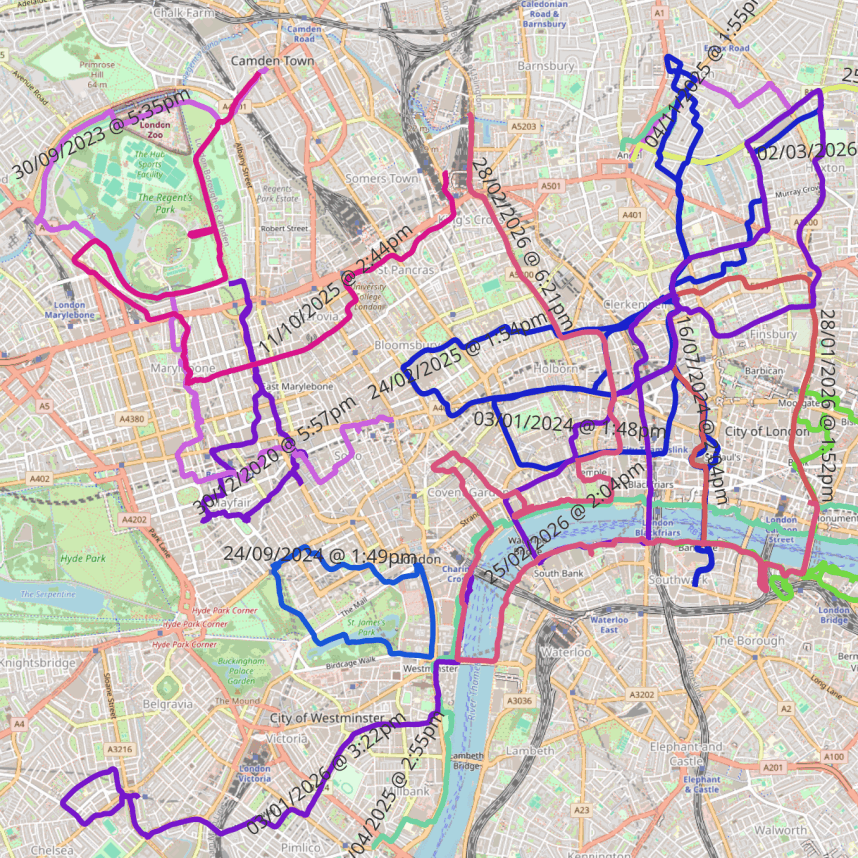
I'm only getting partial success, I've tried several plugins and the main issue I have is getting the object colours to export. Within QGIS I used categorised colours, on the layer symbology to give colours based on the length of each route. I used rounding to nearest 1000m to match distances into sensible identifiable groups, and this worked well. The image at the top of the page shows a sample area.

Mobirise Website Builder
Project 1 conclusion

This was a simple first test of using QGIS, and I've learnt a lot already. 

It's not a complete success, but I'm ok with that, plenty of scope for improvement. 

You'll see on the map I have 200+ routes loaded, and on the exported web version I haven't managed to keep the colours. 

It's a start! 

Drop me a message...

© Copyright 2026 GISMaps.co.uk

‌

No Code Website Builder